Introduction to Network Analysis
In The Network Turn, we learned that:
The network framework shapes how we interpret the world around us. Nothing is naturally a network; rather, networks are an abstraction into which we squeeze the world. Nevertheless, almost anything can be turned into a network, whether it be the interactions between characters in Shakespeare’s plays, the dissemination of memes on Facebook, or the trade network implicated in the ancient Roman brick industry.
But what is a network exactly? In class, we discussed nodes and edges, but we didn’t get a chance to actually talk through how you take cultural data and turn it into a network. So today we will be exploring how to do this with Python.
In The Network Turn Chapter 5, the authors discuss taking correspondence letters and transforming them into networks, using the following information:
- John Smith wrote to Peter Jones three times: on 3 January 1596, 21 March 1596, and 12 December 1597.
- Peter Jones wrote to John Smith once: on 4 February 1596.
- John Smith wrote to Mary Smith twice: on 15 May 1596 and 25 July 1597.
The authors discuss how you can represent this data as networked data with the following figure:
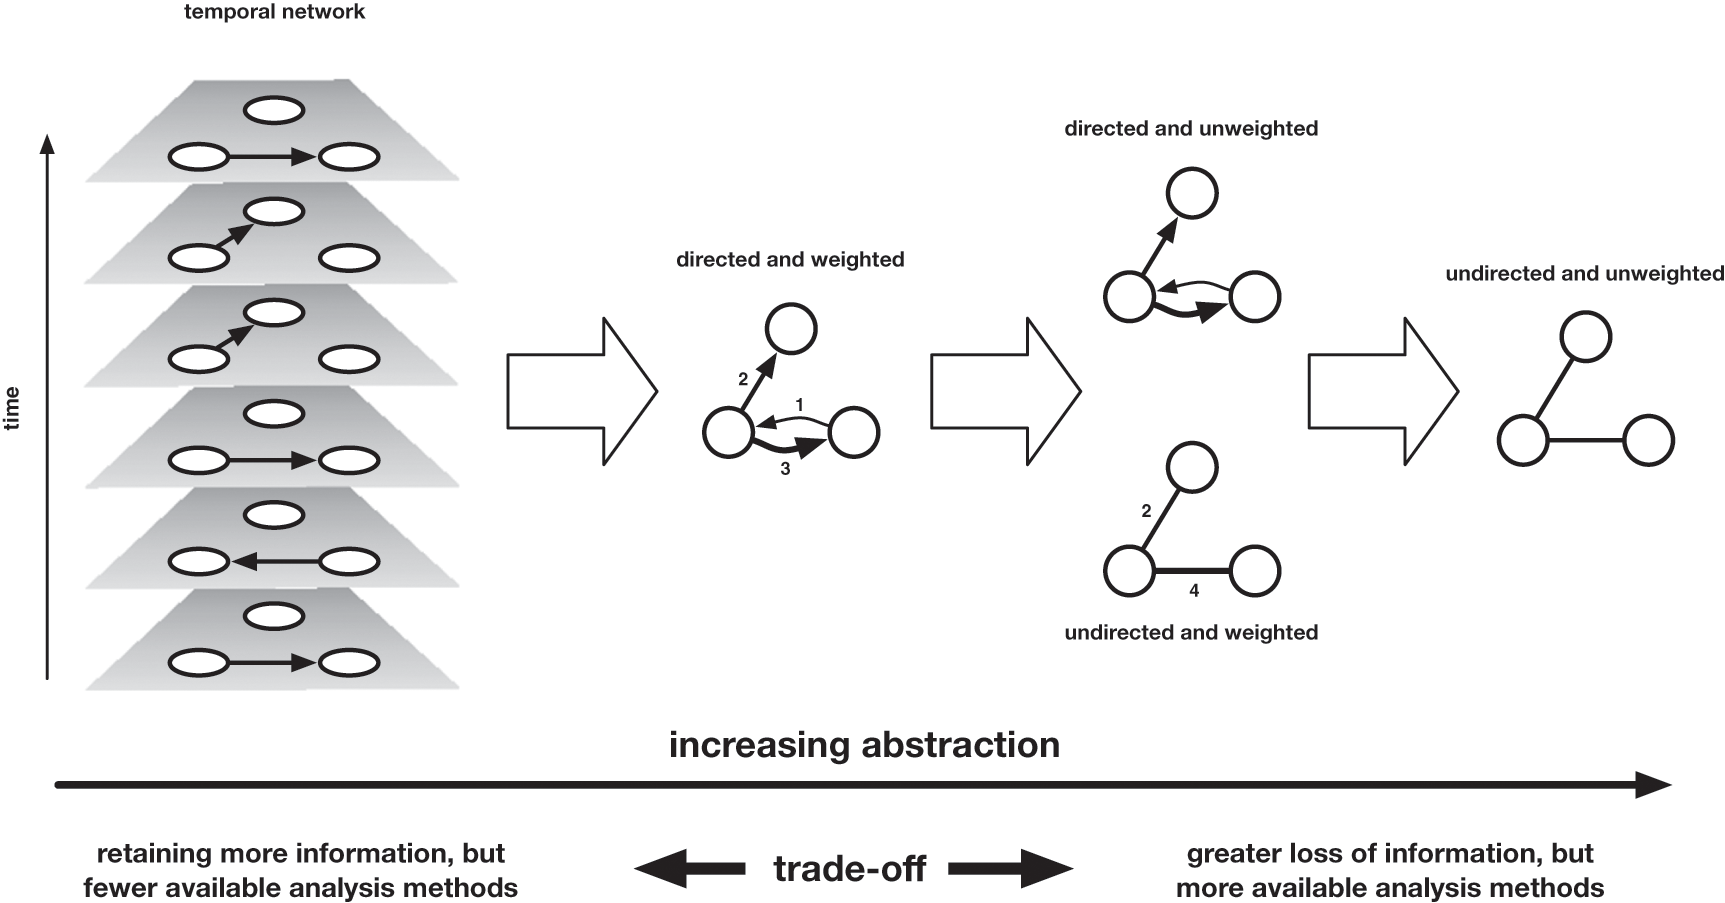
They discuss how if you assume that the individuals are nodes, then you have to decide what information to use to represent edges.
Moving from left to right, we move across a landscape of abstraction, which entails more information loss the further we travel. The rightmost representation of the network merely records the existence of an edge between these nodes, without any attention to the time at which these edges formed, the direction in which letters travelled (who was the sender, who the recipient), or the volume of correspondence that travelled along those edges. One step less abstract is the directed network, which records the direction in which letters travelled (but not the volume), and the weighted network, which encodes the volume of correspondence that marks those edges (but not the direction). One further step leftward is the weighted and directed network, which combines the two previous network attributes, Finally, the leftmost network is a temporal network, which records the direction and time of every item of correspondence separately.
While it might seem obvious to choose the network that most accurately represents these letters, the authors discuss how this version provides the least amount of algorithmic power. So when creating networks from cultural data we need to balance this question of accurately representing our materials with wanting to leverage the power of computation.
Exploring Networks from Cultural Data
In both of our current datasets, the humanist listserv and the Pudding film dialogue, we have a lot of text data. But how do we turn this data into a network? To answer this question, we need to think thoughtfully about the types of relationships that might exist in our data. For example, in the humanist listserv dataset, we’ve used word counts and graphs to show the relationships between different technologies, and in our Pudding film dialogue dataset, we’ve used sentiment analysis to show the relationships between different characters. In both instances, using line graphs and bar charts, we’ve been able to show the relationships between different entities in our data.
But often, we might want to show relationships in a more complex way. This is where network analysis comes in. Network analysis is a way of representing relationships between entities in a dataset. In a network, entities are represented as nodes, and relationships between entities are represented as edges. For example, a very common approach with cultural data is to represent characters in a text as nodes and relationships between characters as edges. This is a way of showing how characters interact with each other in a text.
We can see an example of this in our Notebook for today, where I have included a pre-made dataset derived from the series Game of Thrones. This data was originally compiled by A. Beveridge and J. Shan, “Network of Thrones,” Math Horizons Magazine , Vol. 23, No. 4 (2016), pp. 18-22 and is available from Melanie Walsh’s sample networks datasets repository https://github.com/melaniewalsh/sample-social-network-datasets.

To create the data, the authors did the following process:
We parsed the ebook, incrementing the edge weight between two characters when their names (or nicknames) appeared within 15 words of one another. Afterward, we performed some manual validation and cleaning. Note that an edge between two characters doesn’t necessarily mean that they are friends—it simply means that they interact, speak of one another, or are mentioned together
The result is two datasets, one containing the nodes and the other containing the edges. We can see that the nodes dataset contains the character names and the edges dataset contains the relationships between the characters.
Nodes:
| Id | Label | |
|---|---|---|
| 0 | Aemon | Aemon |
| 1 | Grenn | Grenn |
| 2 | Samwell | Samwell |
| 3 | Aerys | Aerys |
| 4 | Jaime | Jaime |
Edges:
| Source | Target | Weight | |
|---|---|---|---|
| 0 | Aemon | Grenn | 5 |
| 1 | Aemon | Samwell | 31 |
| 2 | Aerys | Jaime | 18 |
| 3 | Aerys | Robert | 6 |
| 4 | Aerys | Tyrion | 5 |
You’ll notice that the Id column in the nodes dataset is the same as the Label column. This is because the Id column is the unique identifier for the node, and the Label column is the name of the node. The Source and Target columns in the edges dataset represent the relationships between the nodes and contain values from the nodes. The Weight column represents the strength of the relationship between the nodes, in this case, the number of times the characters interacted in the text.
We can now use this data to create a network. We will use the networkx library to create the network. This library is a powerful tool for creating and analyzing networks in Python.
import networkx as nx

nodes_df = pd.read_csv("https://raw.githubusercontent.com/melaniewalsh/sample-social-network-datasets/master/sample-datasets/game-of-thrones/got-nodes.csv")
edges_df = pd.read_csv("https://raw.githubusercontent.com/melaniewalsh/sample-social-network-datasets/master/sample-datasets/game-of-thrones/got-edges.csv")

G = nx.from_pandas_edgelist(edges_df, source='Source', target='Target', edge_attr='Weight')
To create this network, we are using the from_pandas_edgelist method that is built into networkx to create a graph from a pandas DataFrame. We can see the documentation for this method https://networkx.org/documentation/stable/reference/generated/networkx.convert_matrix.from_pandas_edgelist.html.

Now that we have created our network, we can start to analyze it. We can use the networkx library to visualize this network’s nodes and edges.
nx.draw(G)
Here we are using the built-in draw method from networkx to visualize our network and we can find the documentation for this method here.
The resulting network will look something like this:
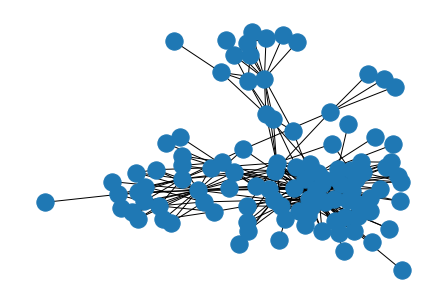
You might recognize this type of network visualization, even if you haven’t created one before. This is called a force-directed graph, and it is a common way to visualize networks. In a force-directed graph, the nodes are placed in such a way that the edges between them are as short as possible.
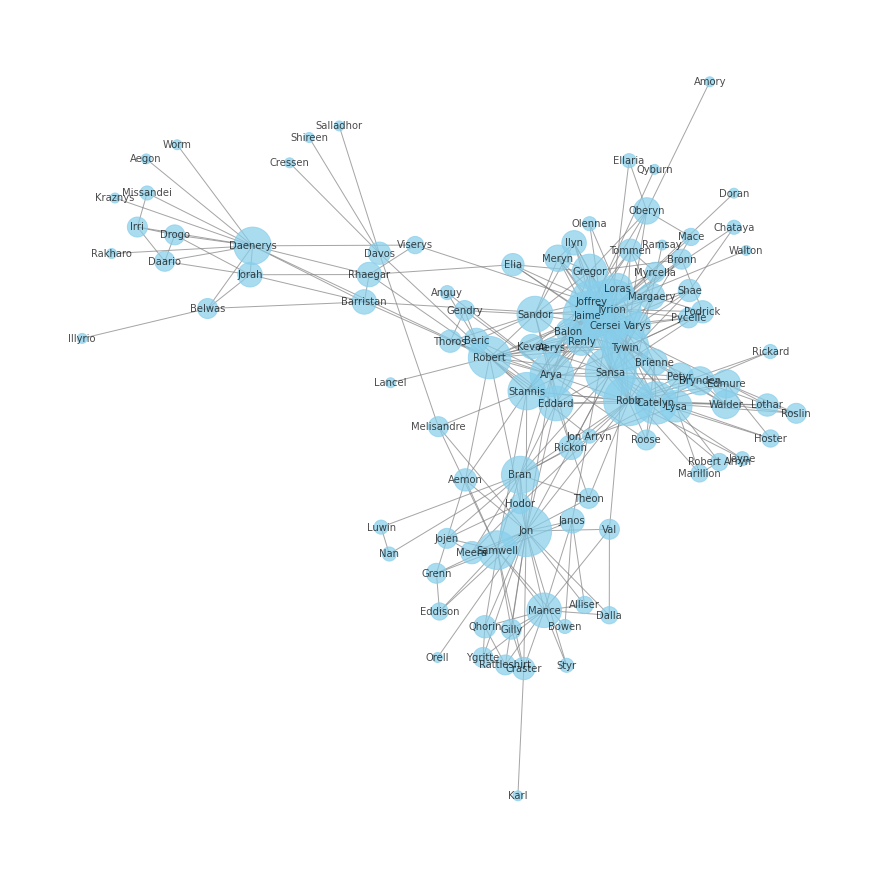
We can make this even more readable by adding labels to the nodes and spreading them out a bit more. To run this code you’ll need to install the matplotlib library.
import matplotlib.pyplot as plt

plt.figure(figsize=(12, 12))
nx.draw(G, with_labels=True, font_size=10, node_size=1000, node_color='skyblue', edge_color='gray')
plt.show()
This will give us a more readable network visualization:

Now we are starting to see more clearly how the characters in Game of Thrones interact with each other. We can see that some characters are more in the middle (that is central) to the network than others, and we can start to think about what this might mean for the story.
Network Algorithms
Part of why the authors of The Network Turn talk about the tradeoff between accuracy and computational power is that network analysis is a powerful tool for understanding relationships between entities in a dataset. There are many different algorithms that can be used to analyze networks, and these algorithms can help us understand the relationships between entities in a dataset.
For example, rather than just visualizing the network, we can use network algorithms to calculate different metrics about the network. For example, we can calculate the degree of a node, which is the number of edges that connect to that node. We can also calculate the betweenness centrality of a node, which is a measure of how important a node is in the network. We can also calculate the shortest path between two nodes, which is the shortest path that connects those two nodes.
To do this, we can use networkx to calculate these metrics. For example, to calculate the degree and betweenness centrality of the nodes in our network, we can use the following code:
# Calculate degree and betweenness centrality
degree_centrality = nx.degree_centrality(G)
betweenness_centrality = nx.betweenness_centrality(G)

# Create dataframes from the centrality measures
degree_df = pd.DataFrame(sorted(degree_centrality.items(), key=lambda x: x[1], reverse=True), columns=['Node', 'Degree Centrality'])
betweenness_df = pd.DataFrame(sorted(betweenness_centrality.items(), key=lambda x: x[1], reverse=True), columns=['Node', 'Betweenness Centrality'])

# Print the top five nodes for each measure
print("Degree Centrality")
print(degree_df.head(5))
print("\nBetweenness Centrality")
print(betweenness_df.head(5))
This gives us the top five nodes for each measure:
Degree Centrality
| Node | Degree Centrality |
|---|---|
| Tyrion | 0.339623 |
| Jon | 0.245283 |
| Sansa | 0.245283 |
| Robb | 0.235849 |
| Jaime | 0.226415 |
Betweenness Centrality
| Node | Betweenness Centrality |
|---|---|
| Jon | 0.229965 |
| Robert | 0.209452 |
| Tyrion | 0.197913 |
| Daenerys | 0.157203 |
| Robb | 0.126964 |
We can see that the characters with the highest degree centrality are Tyrion, Jon, and Sansa, and the characters with the highest betweenness centrality are Jon, Robert, and Tyrion. This tells us something about how the characters play different roles in the story.
For example, characters with high degree centrality are well-connected to other characters in the network, while characters with high betweenness centrality are important for connecting different parts of the network. So in this case, a character like Daenerys might not interact directly with as many characters as a character like Tyrion, but she is important for connecting different parts of the story.
We can also update our visualization to see these differences. For example, we could size each node by each of these metrics:
# Visualize network with degree centrality as node size
plt.figure(figsize=(12, 12))
node_size = [G.degree(v) * 100 for v in G]
nx.draw(G, with_labels=True, font_size=10, node_color='skyblue', edge_color='gray', node_size=node_size, alpha=0.7)
plt.show()
Which gives us a visualization where the size of the nodes is proportional to their degree centrality:
And we can do the same for betweenness centrality:
# Visualize network with betweenness centrality as node size
plt.figure(figsize=(12, 12))
node_size = [v * 10000 for v in betweenness_centrality.values()]
nx.draw(G, with_labels=True, font_size=10, node_color='skyblue', edge_color='gray', node_size=node_size, alpha=0.7)
plt.show()
Which gives us a visualization where the size of the nodes is proportional to their betweenness centrality:

Now we can see how choosing a certain metric changes our interpretation of the network and those nodes, allowing us to surface different aspects of the data.
We can read more about each method in the networkx documentation: degree_centrality and betweenness_centrality, and also experiment with other centrality measurements that we can see listed herehttps://networkx.org/documentation/stable/reference/algorithms/centrality.html.
Another very commonly used algorithm is not just to look at individual nodes, but groups of nodes through algorithms designed to find communities. One of the most popular algorithms for this is the Louvain algorithm, which is a method for detecting communities in large networks. The Louvain algorithm is a hierarchical clustering algorithm that optimizes the modularity of a partition of the network. The modularity of a partition is a measure of how well the partition captures the community structure of the network.
What that means in more simple terms is that the Louvain algorithm is a way of finding groups of nodes in a network that are more densely connected to each other than to nodes in other groups. For example, in your social network, you might be connected to many people, but some of those connections will have more connections in common with you than others. The Louvain algorithm is a way of finding those groups of people.
We can use the following code to run the Louvain algorithm on our network and visualize the communities that it finds:
from networkx.algorithms import community

# Compute the best partition
communities = community.louvain_communities(G, seed=123)

# Create a dictionary that maps each node to its community
community_map = {}
for i, com in enumerate(communities):
    for node in com:
        community_map[node] = i

# Create a list of colors based on the community of each node
colors = [community_map[node] for node in G.nodes()]

# Draw the graph
plt.figure(figsize=(12, 12))
nx.draw(G,  node_color=colors, with_labels=True, font_size=10, node_size=1000, edge_color='gray')
plt.show()
This will give us a visualization of the communities in our network:

We can read more about this particular algorithm here https://networkx.org/documentation/stable/reference/algorithms/generated/networkx.algorithms.community.louvain.louvain_communities.html#networkx.algorithms.community.louvain.louvain_communities, and also explore other ways of finding communities in networks here https://networkx.org/documentation/stable/reference/algorithms/community.html.
Creating Networks from Cultural Data
So far, we have been using pre-made network data to explore network analysis. But how do we create networks from our own cultural data? In class, we discussed how we might create networks from the Pudding film dialogue dataset. We could create a network where the nodes are characters and the edges are relationships between characters. For example, we could create a network where the edges are the number of times two characters speak to each other in a film.
To do that though, first we need to create networked data from our scripts. Luckily for us, the Pudding already identified characters for us, so we can use this data to create a network. We can use the following code to create a network from the Pudding data:
from itertools import combinations
from tqdm import tqdm

def get_character_interactions(script, character_list, window_size):
    edges = []
    for i in tqdm(range(0, len(script), window_size)):
        window = script[i:i+window_size]
        character_interactions = {}
        for character1, character2 in combinations(character_list, 2):
            character1_first_word = character1.split()[0]
            character2_first_word = character2.split()[0]
            character_interactions[(character1_first_word, character2_first_word)] = 0
        for character1, character2 in character_interactions.keys():
            if (character1.lower() in window.lower()) and (character2.lower() in window.lower()):
                character_interactions[(character1, character2)] += 1
        for pair, count in character_interactions.items():
            if count > 0:
                edges.append((*pair, count))
    edges_df = pd.DataFrame(edges, columns=['source', 'target', 'weight'])
    return edges_df

# Select one film
selected_film = film_scripts_df[film_scripts_df['title'] == 'Twilight']
selected_film_script = selected_film['script'].values[0]

selected_characters = character_list_df[character_list_df['script_id'] == selected_film['script_id'].values[0]]
selected_characters_list = selected_characters['imdb_character_name'].unique().tolist()

# Get the list of characters
window_size = 100000 # Define your window size here
twilight_edges = get_character_interactions(selected_film_script, selected_characters_list, window_size)
In this code, we are creating a network from the Twilight film script. We are using the get_character_interactions function to create a network from the script. This function takes the script, a list of characters, and a window size as input and returns a DataFrame with the edges of the network.
We can then use this data to create a network using the networkx library:
grouped_twilight_edges = twilight_edges.groupby(['source', 'target']).weight.sum().reset_index()
twilight_network = nx.from_pandas_edgelist(grouped_twilight_edges, source='source', target='target', edge_attr='weight')
plt.figure(figsize=(12, 12))
nx.draw(twilight_network, with_labels=True, font_size=10, node_size=1000, node_color='skyblue', edge_color='gray')
plt.show()
This produces the following visualization:
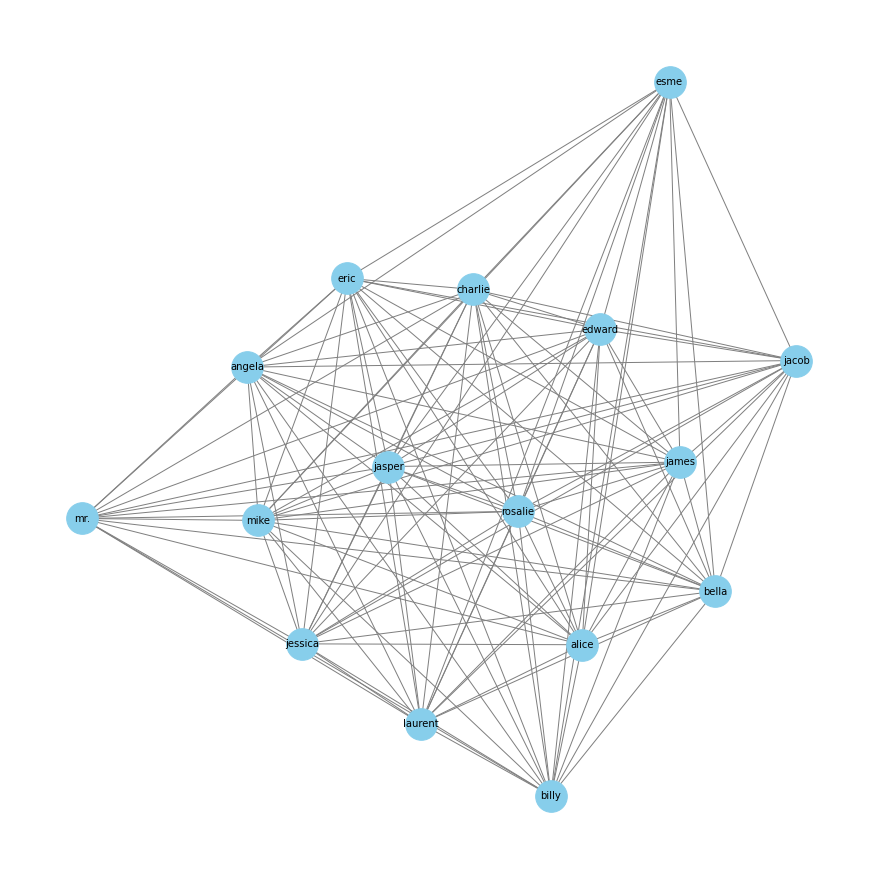
Now we can see how the way we created our network changes the relationships between the characters. We can also use the network algorithms we discussed earlier to analyze this network and understand the relationships between the characters.
Experimenting With Cultural Networks Homework (Optional Bonus)
This homework assignment is optional, but can provide bonus participation points. If you decide to complete this assignment, you should create a network from a film script in the Pudding film dialogue dataset. You can choose any film script from the dataset and create a network from it. You can use the code we discussed in class to create the network and visualize it. You can also experiment with different window sizes to see how this changes the network. You should try one of the other centrality algorithms we discussed in class and visualize the network with the node size proportional to these metrics.
You should create a new folder in your is310-coding-homework folder called network_analysis and save your code there. Once you have completed the homework, you should post a link to your folder in this GitHub discussion https://github.com/ZoeLeBlanc/is310-computing-humanities-2024/discussions/9.